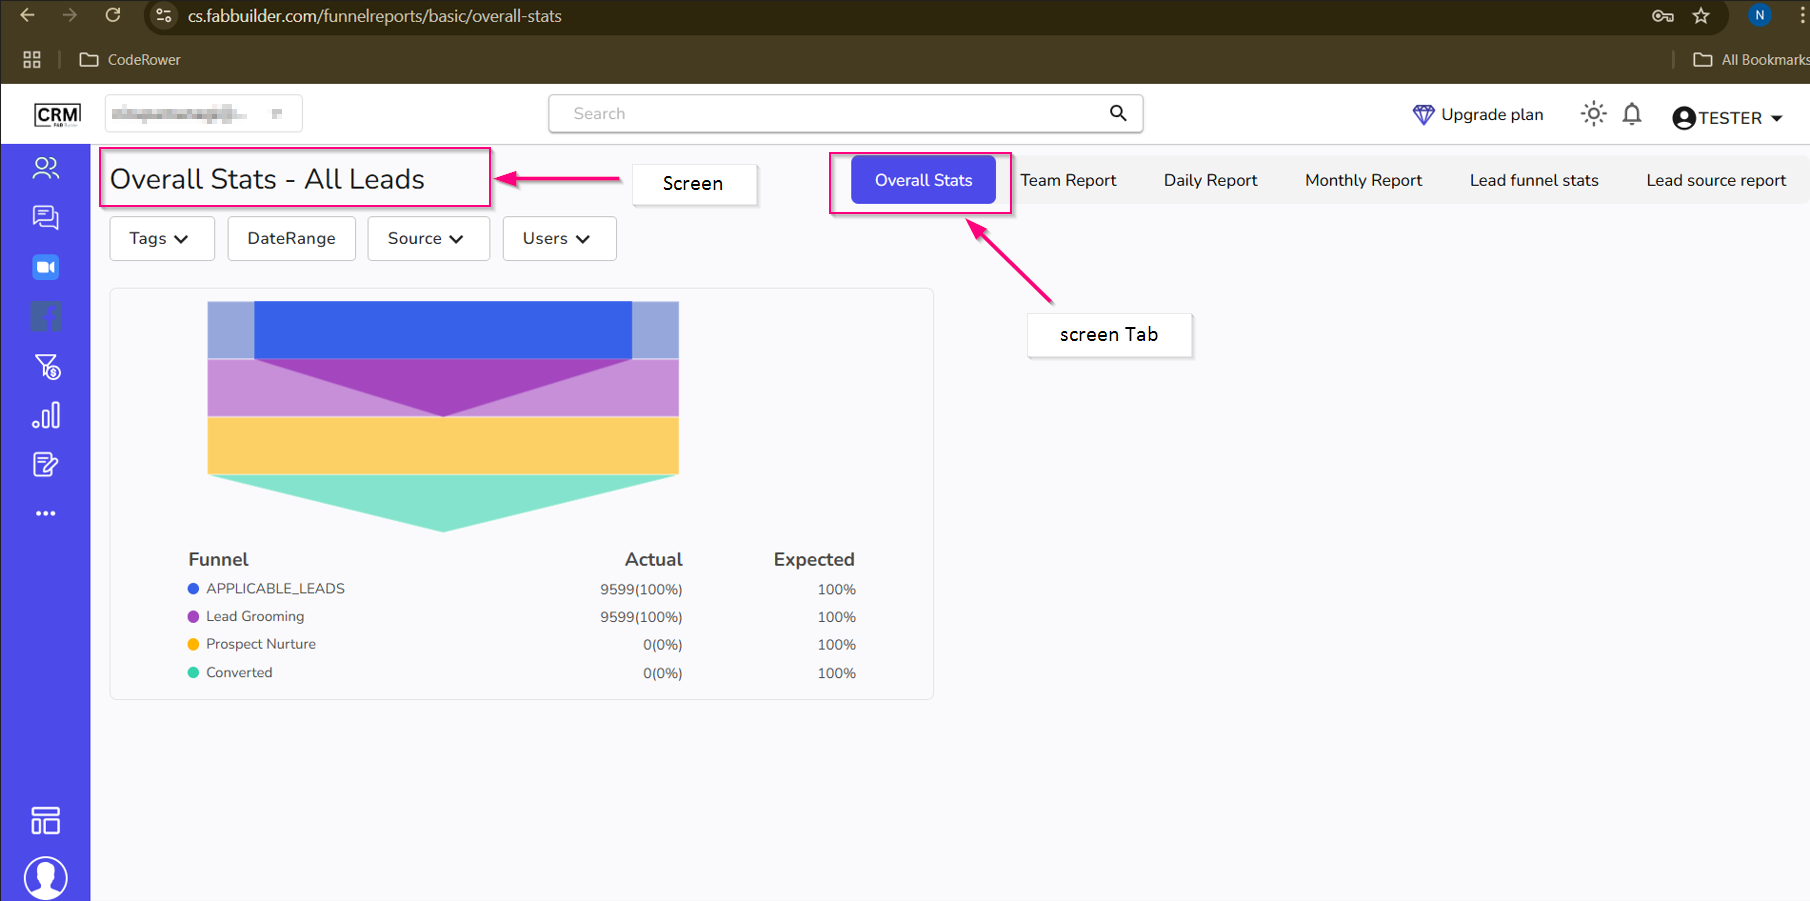
The Funnel Report (Overall Stats) provides a complete view of lead progression across different funnel stages using a visual funnel. The data columns display a comparison between Actual and Expected performance for each stage.
Users can apply filters such as Tags, Date Range, Lead Source Channel, and Captured By User to analyze specific lead data. This screen also provides access to other related reports.
Main Screen Components- 1. Filters area section 2. Funnel Stages (color-coded) with data
. Filters Section Area (Top Panel)
- Tag-Filters leads based on assigned tags or labels (for example, Important).
- Date Range-Allows selection of preset or custom date ranges to analyze lead data for a specific period.
- Source-Filters leads based on their source, such as Website, Ads, or Social Media.
- Users-Displays lead data based on selected CRM users or team members who captured or handled the leads
2. Funnel Stages – Visual Representation with Data
This section visually represents the distribution of leads across various funnel stages using color coding, such as Applicable Lead Stage and Grooming Stage,Prospect nurture, Converted.
The Actual vs Expected columns in the overall statistics show a comparison of real performance against projected values for each funnel stage, helping businesses evaluate conversion efficiency and identify gaps in the sales process..